Designing a Low Latency 10G Ethernet Core - Part 4 (Performance Measurement and Comparison)
![]() View the code on GitHub
View the code on GitHub
Links to the other parts in this series:
- Introduction
- Design Overview and Verification
- Low Latency Techniques
- Performance Measurement and Comparison (this post)
- Potential Improvements
Performance Measurement and Comparison
In this part, we will analyse the performance of the core and compare it to commercial offerings.
Market Analysis
There are a number of low latency and ultra-low latency IP cores available commercially, primarily from HiTek Systems, Orthogone and LDA Technologies. Each provide a product brief for their cores which I have summarised below.
| Name | Estimated Loopback Latency (ns) | Measurement Method | Interface Width | Core Clock | Notes |
|---|---|---|---|---|---|
| HiTek Systems 10G Low Latency Ethernet FPGA IP Core Solution | 318.8 + transceiver latency (346.63ns) | Sum of MAC, PCS delay for Tx and Rx | 32-bit | Supports older (6-series) parts. Designed in 2012 | |
| HiTek Systems Ultra-Low Latency 10G Ethernet IP Solution | 52.7 + transceiver latency (80.53ns) | Sum of MAC, PCS delay for Tx and Rx | 32-bit | ||
| Orthogone Ultra-Low Latency 10G Ethernet MAC and PCS (Previous generation) | 67ns | Sum of MAC, PCS, GTY delay for Tx and Rx | 32-bit | ~322MHz | |
| Exablaze ExaMAC | 45.72ns | TxSoP to RxSoP with CDC, minus cable delay | 32-bit | ~322MHz | Exablaze now part of Cisco, core seemingly discontinued |
| Orthogone Ultra-Low Latency 10G Ethernet MAC and PCS (Current Generation) | 34.1ns | “GTY + MAC/PCS + CDC (Measured from TxSoP to RxSoP using serial loopback)” | 32-bit | ~644MHz | |
| LDA Tech Ultra-low latency 10 GbE MAC/PCS (32bit/322MHz) | 19.9 (MAC/PCS) + 15.6 (GTY) = 33.5ns | Sum of MAC, PCS, GTY delay for Tx and Rx + Rx CDC | 32-bit | ~322MHz | Note the 16-bit GTY delay quoted. If 32-bit mode used in GTY total latency is 47.43ns |
| LDA Tech Ultra-low latency 10 GbE MAC/PCS (16bit/644MHz) | 6.2 (MAC/PCS) + 15.6 (GTY) = 21.8ns | Sum of MAC, PCS, GTY delay for Tx and Rx | 16-bit | ~644MHz | |
| Orthogone Ultra-Low Latency 10G Ethernet MAC and PCS (Current Generation) | 20.2ns | “GTY + MAC/PCS (Measured from TxSoP to RxSoF using serial loopback)” | 16-bit | ~644MHz | Note difference between SoP (Start of Packet) and SoF (Start of Frame) |
There’s a range of performances here, but also a range of measurement methods which is important to keep in mind when comparing cores. Note the HiTek cores don’t provide the transceiver latency values, so I’ve obtained them from this analysis from Xilinx - Low Latency Transceiver Designs for Quantitative Finance.
Performance Measurement
As seen above, there are a number of ways to measure the latency of the core. An excellent analysis of these methods is presented by Exablaze here - The Big Mac Mystery - How do you measure a MAC? and summarised below:
- Count the cycles taken for data to propagate through MAC/PCS for transmit and receive
- Connect transceivers in loopback, measuring time taken from the start of transmit packet to start of receive packet (crossed into TX clock domain)
- Connect MAC interfaces in loopback, measuring time taken from the start of receive packet to start of transmit packet at the transceiver interface
- Set a trigger to send a packet when the eSoF (PCS start of frame) is detected, measuring time taken from the start of receive packet to start of transmit packet
- Set a trigger to send a packet when the SoF (MAC start of frame) is detected, measuring time taken from the start of receive packet to start of transmit packet
Option 1 is the most commonly quoted on the product briefs, but is also the least realistic. Options 3,4 and 5 require specialist timing equipment which I don’t have access to, and seemingly none of the other cores listed are tested in this manner. Option 2 presented the best balance between practicality and a representative test scenario.
As discussed in Part 2, the example design measures latency by connecting the transceiver in serial loopback. A signal is sent to a timer a the start of a transmit packet, which counts until the start of the receive packet is detected, after crossing the clock domains.
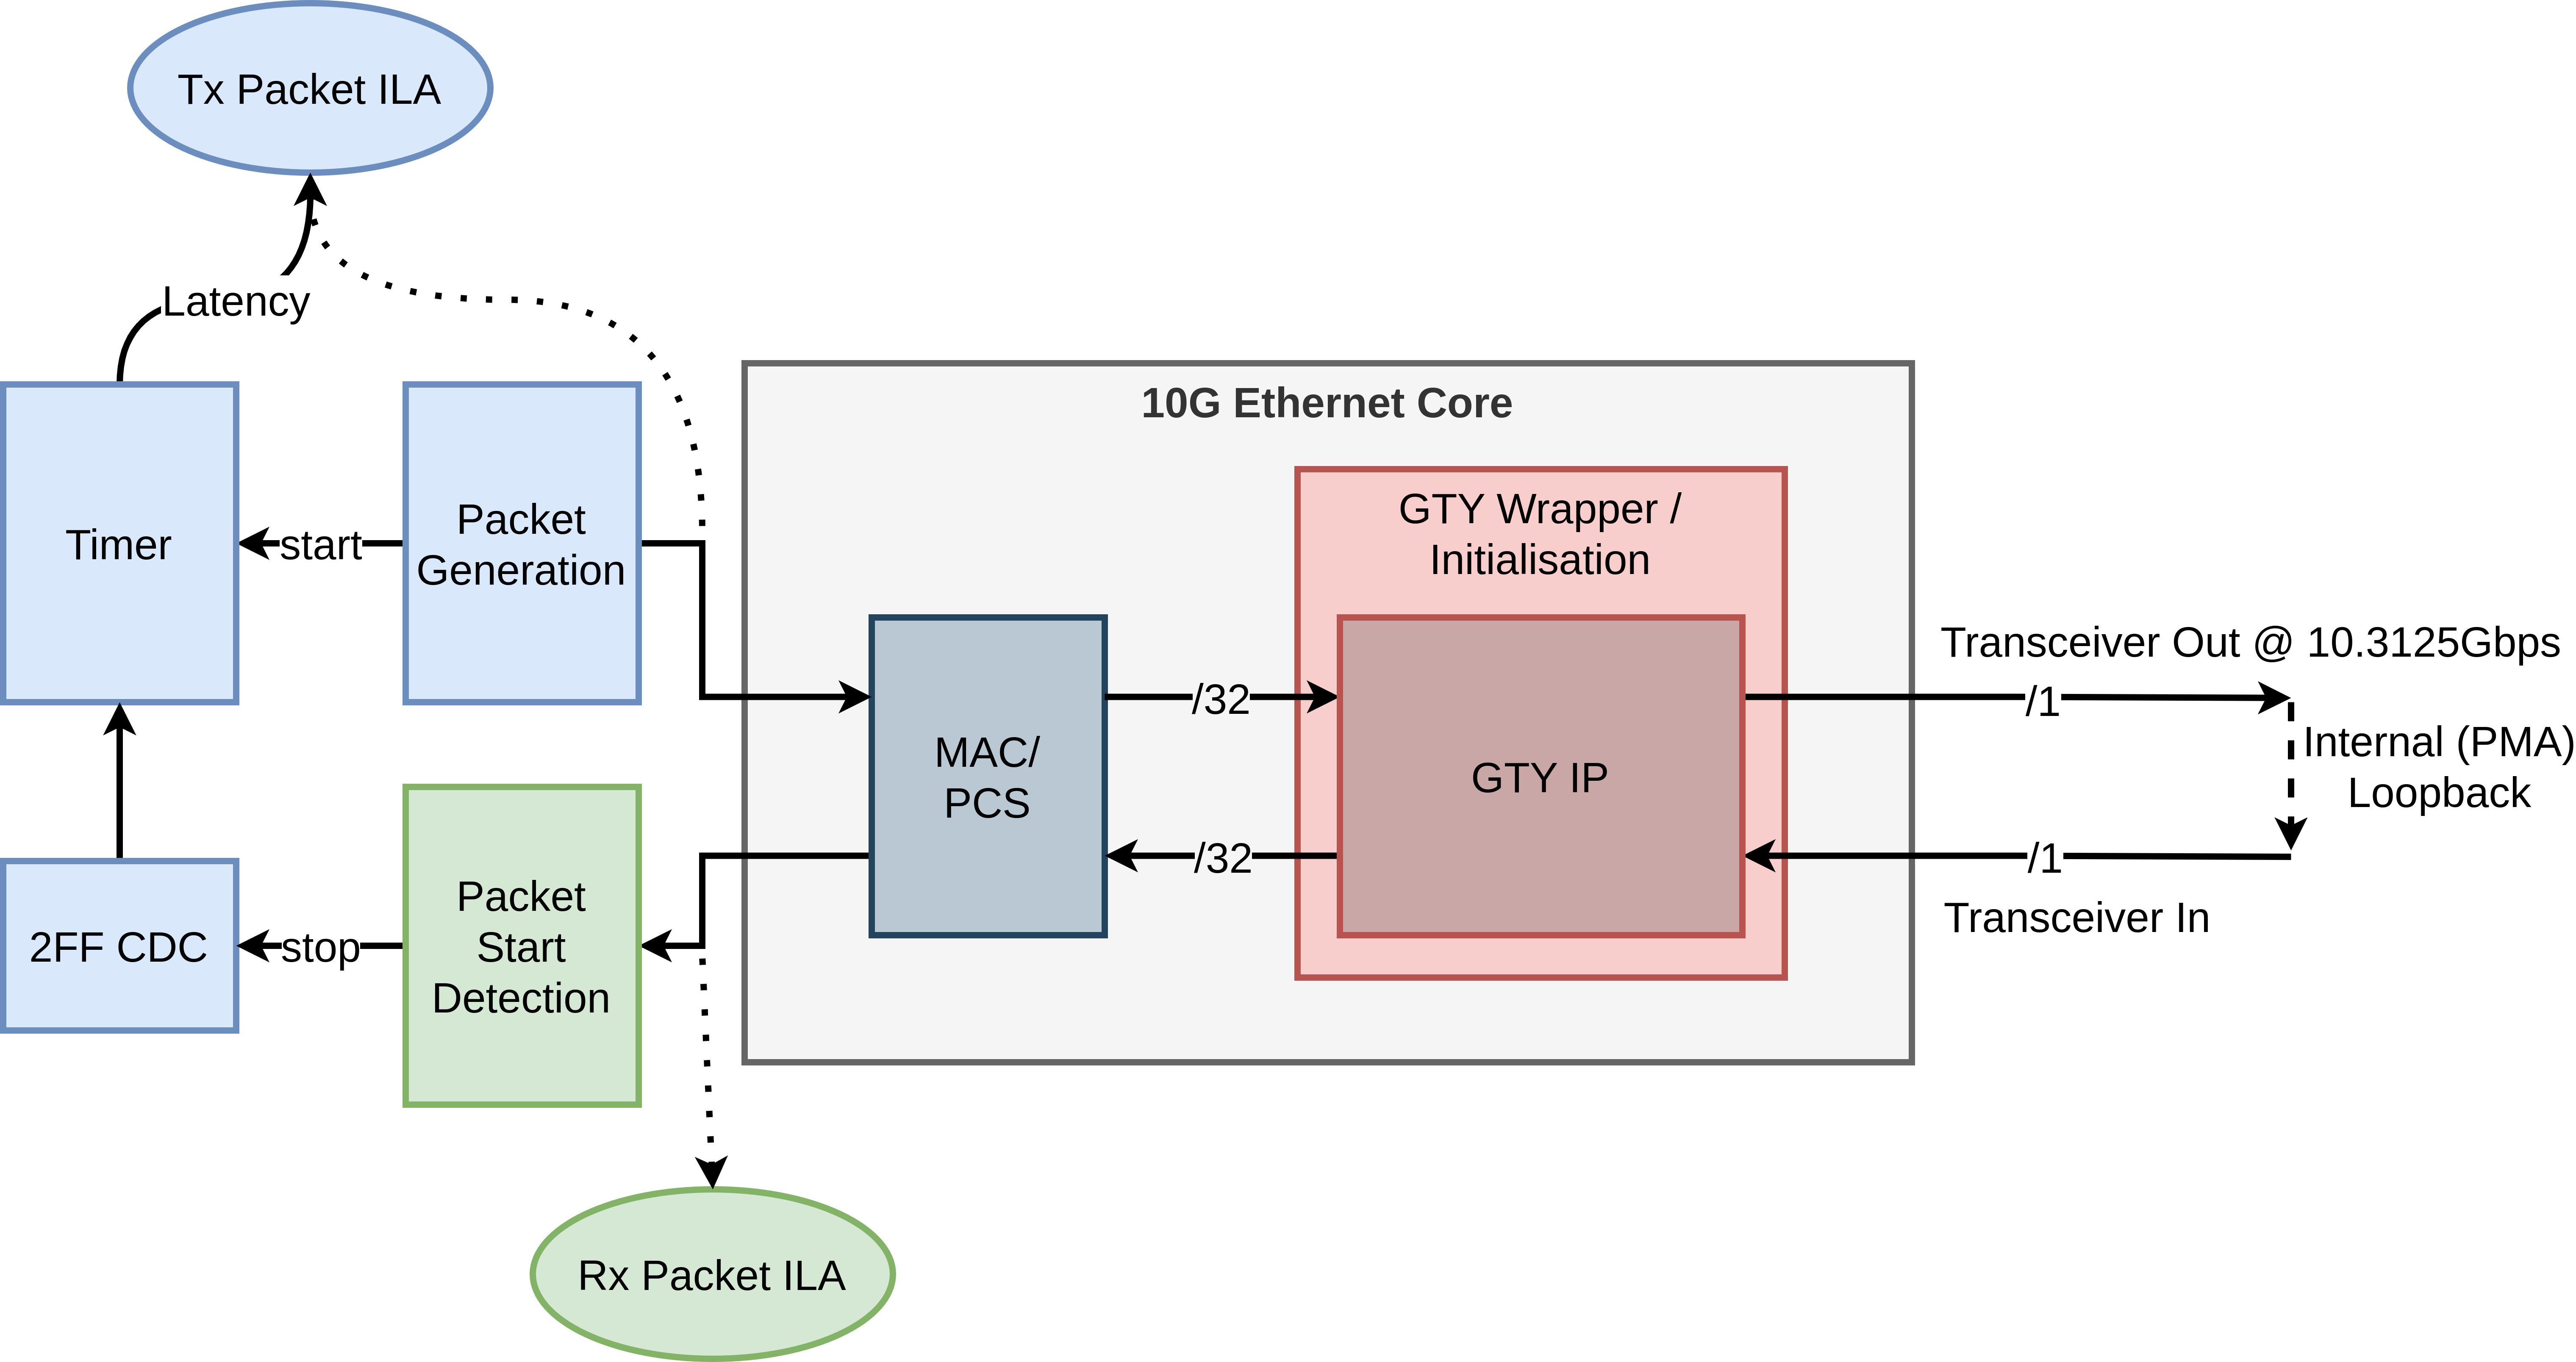
Figure 1: Example Design Overview
It’s worth noting there are arguably multiple options for detecting the ‘start of a packet’:
- The first byte of user data (payload) presented by the MAC
- The MAC layer start of frame delimiter (SFD = 0xD5)
- The PCS layer start character (RS START = 0xFB). This replaces the first octet of the 7 octet preamble.
Exablaze use the terms eSoF (early start of frame) and SoF (start of frame) to distinguish these which I will also use. However, Orthogone reference SoP and SoF, and it’s not clear how these align.
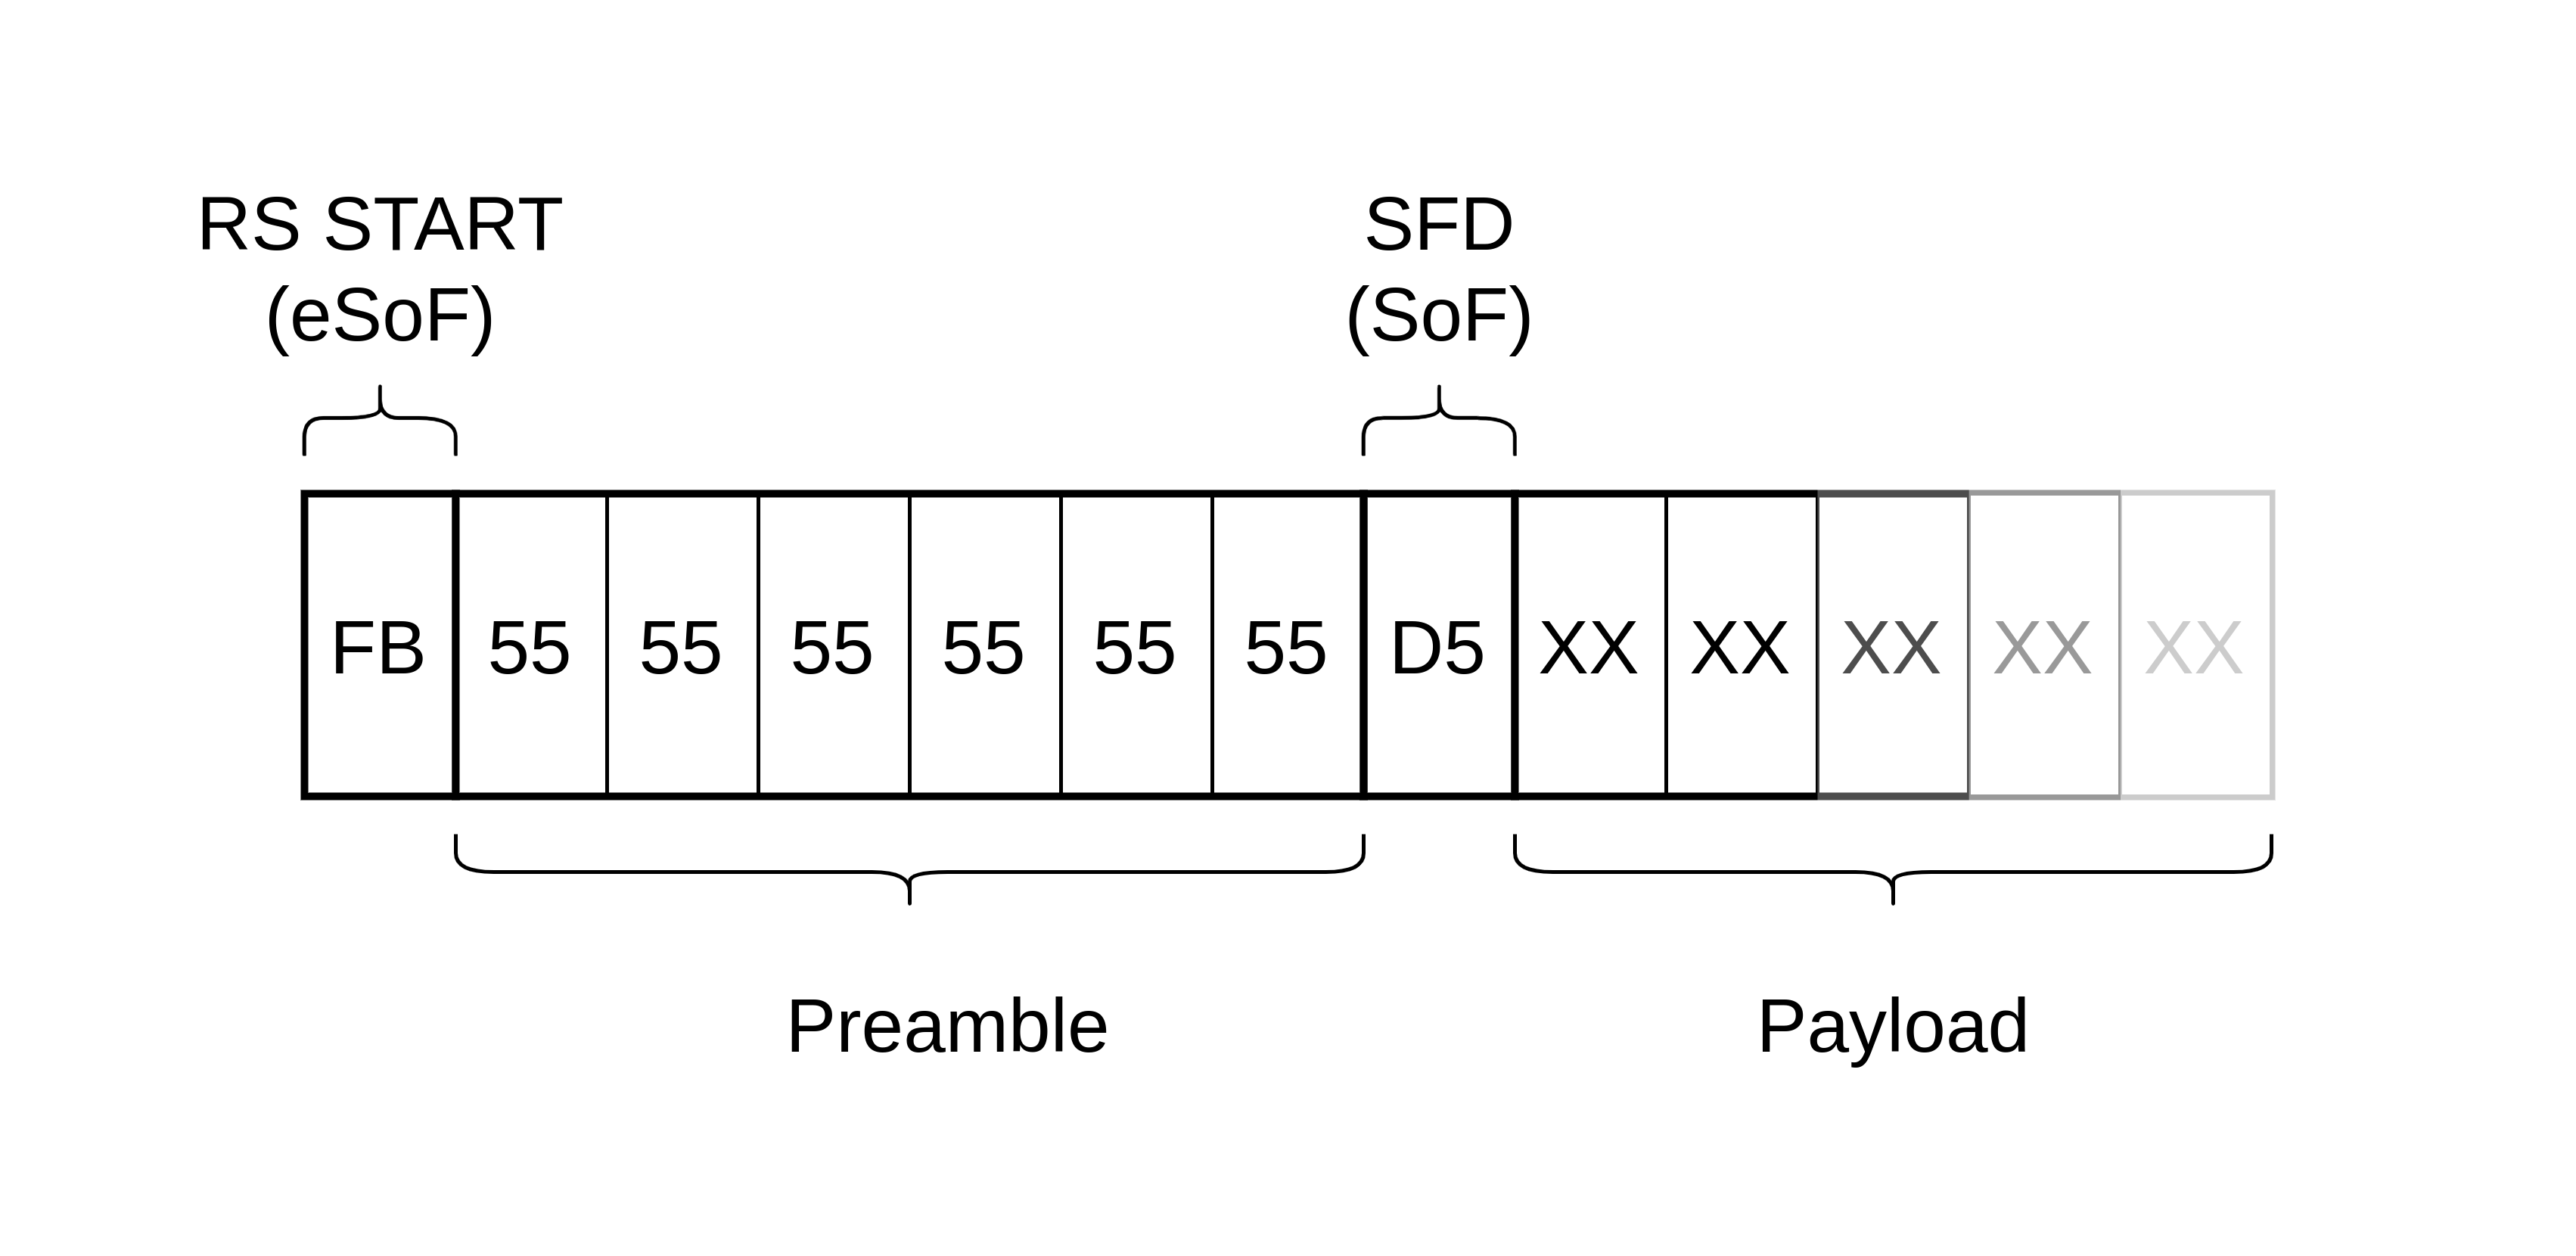
Figure 2: Start of Layer 2 Ethernet Frame (prior to block encoding)
For my testing, the start trigger is the cycle on which data is presented to the core and the core is ready to receive it, and the end trigger is when the first byte of user data in the payload is received. This is the most pessimistic option, however the usefulness of the SoF character without any user data is arguable, so I feel that it is the most representative.
The measured average latency for the core using the method above is 58.2ns. This was measured across a few thousand packets of different sizes using a script to automatically capture data from the latency measurement ILA in the example design.
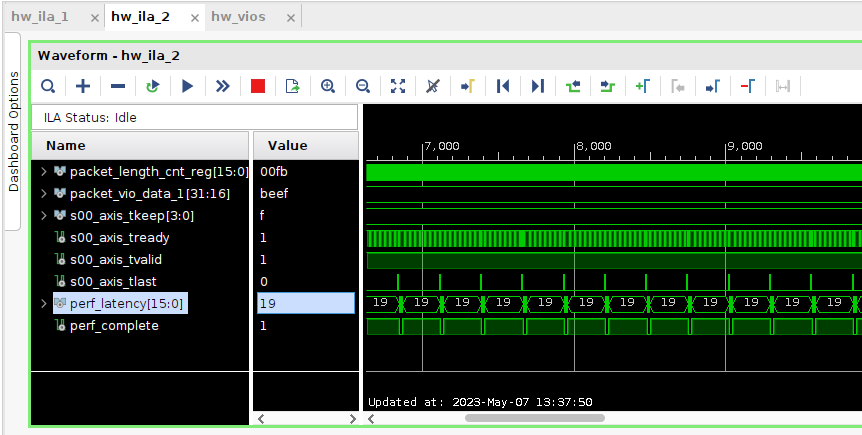
Figure 3: Latency Measurement ILA
As the SoF arrives exactly 1 cycle earlier, and eSoF arrives 2 cycles earlier, we can calculate alternative latency values for comparison:
- User data TX to User data RX (including CDC): 58.2ns
- User data TX to SoF (SFD) (including CDC): 55.1ns
- User data TX to eSoF (RS START) (including CDC): 52.0ns
Regardless of methodology, this puts us right in the middle of the cores analysed above, but at the lower end of performance for the latest designs. In the next and final part, I’ll look at ways the design could be improved to compete with the best on the market.
Next Post - Potential Improvements